.png)
Data Sources: 2018-2022 American Community Survey and the U.S. DOE’s Low-Income Energy Affordability Data (LEAD) Tool, accessed 9/3/2024
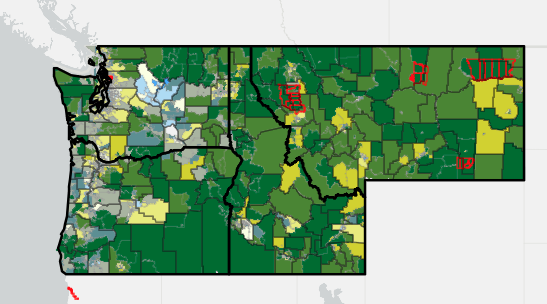
In 2022, the Inflation Reduction Act (IRA) was passed, providing $8.8 billion in home energy efficiency upgrades and electrification rebates. Importantly, the rebate amount households are eligible for depends on Area Median Income (AMI). In this case, households categorized as having an income between 0% and 80% of their tract’s AMI will receive the greatest rebates, while houses between 80-150% AMI will receive a smaller rebate, and households with an income above 150% of the AMI will receive the smallest rebates.
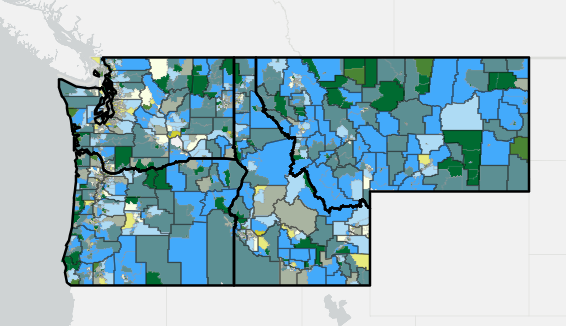
This map shows the percentage of households that will receive the greatest rebates (i.e., their incomes are 0-80% AMI) paired with the percentage of households that own their homes. Homeownership is important because many rebates in the 2022 IRA, such as replacing one’s heating, ventilation, and air conditioning (HVAC) system, are more challenging for renters because they require coordination with the landlord.
Across the Northwest, there are important differences in communities eligible for the greatest IRA rebates (i.e., the percent of households with an income of 0-80% of AMI). For example, the median percentage of households eligible for the greatest IRA rebates ranges from 35.2% in Idaho communities to 42.4% in Montana communities. Meanwhile, the median percentage of households eligible for the greatest IRA rebates in Washington and Oregon falls between the two, with medians of 36.7% and 28.4%, respectively.
Click on the "i" in the upper left-hand corner to open the map legend. Use the options in the lower right-hand corner to open in ArcGIS map viewer, view in full screen, search for an address, return to the default zoom view, and zoom in and out. Click on the map to see associated data.
The map is divided into census tracts, which are color-coded to show the community-level relationship between IRA eligibility and homeownership. Black lines indicate counties, and red lines indicate Tribal Lands.
The darkest green (top center square in the legend) indicates communities with high percentages of people eligible for the greatest IRA rebates (0-80% AMI) and high proportions of homeownership.
The blue (right corner square) indicates communities with high percentages of people who own their homes but low percentages of households eligible for the greatest IRA rebates, and the light green (left corner square) shows the opposite - high percentages of households eligible for the greatest IRA rebates but low percentages of people who own their homes.
Lastly, the light yellow (bottom center square) shows areas that have low percentages of both households eligible for the greatest IRA rebates and low percentages of people who own their homes.
Note: The white area between Yakima County and Franklin County is Hanford, a decommissioned nuclear production site where no one is permitted to live within 35 miles.