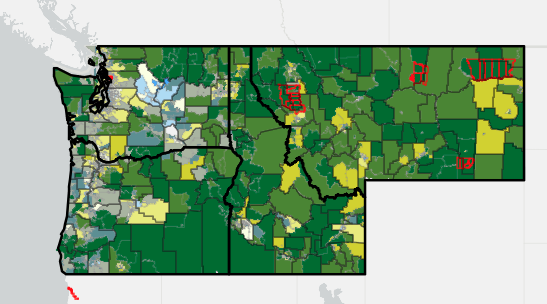
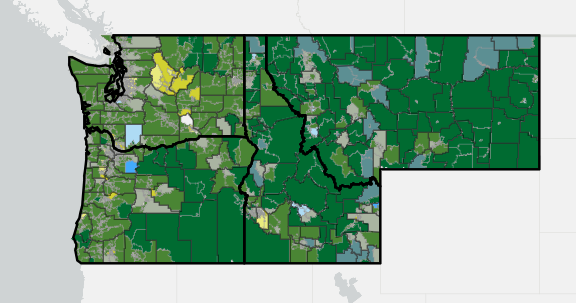
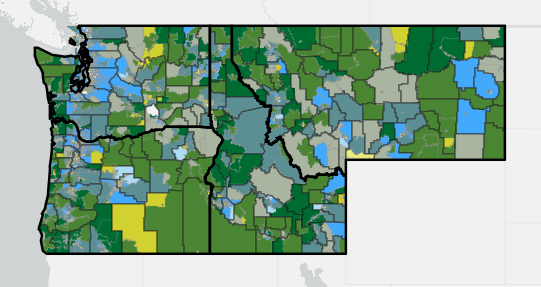
.png)


Natural gas is used for a variety of purposes including space and water heating; cooking and other appliances; direct use in industrial processes, such as manufacturing and chemical extraction; and electricity production.
This visualization shows data related to natural gas utilities in Oregon and Washington. It focuses on sales for residential, commercial, and industrial (RCI) customers. It excludes sales to electric power (i.e., natural gas used for power generation) and vehicle fuel customers, which represented only a small share of utility sales since 1997 and were negligible since 2008. It also excludes transported natural gas volumes and customers, where the utility provides transportation and delivery service through its infrastructure but does not own the gas itself.
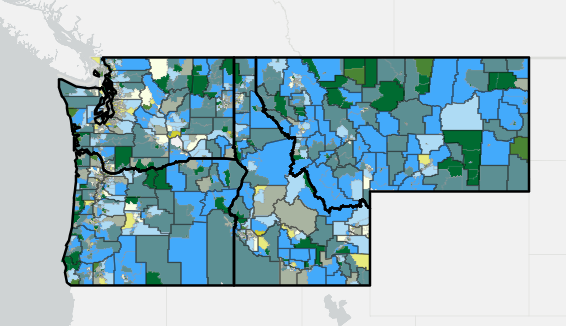
The first tab of this visualization shows the approximate service areas of natural gas utilities in Oregon and Washington, with light grey shading indicating areas with no natural gas service. The four investor-owned utilities—Avista, Cascade Natural Gas, Northwest Natural Gas (NW Natural), and Puget Sound Energy (PSE)—are regulated by either the Oregon Public Utility Commission or the Washington Utilities and Transportation Commission, depending on the location of service. The cities of Ellensburg and Enumclaw have their own municipally-owned natural gas utilities. The city of Buckley also had its own municipal natural gas utility until it was bought by Puget Sound Energy in 2013.
Of Oregon and Washington natural gas utilities, PSE provides service to the largest number of customers (mostly residential), followed by NW Natural. In the two states, natural gas service is mostly concentrated in urban areas, with some pockets in rural areas, as natural gas distribution networks do not usually extend to less populated areas.
The second tab shows selected operations data from 1997-2024 for RCI sales: volume in thousand cubic feet (Mcf), revenue in dollars, and number of customers. Sales volume and revenue are impacted directly and indirectly by a variety of factors, including wholesale market prices, extreme weather conditions, geopolitical events including wars, and other shifts in international demand. For example, in 2000-2001, the spike in sales volume and revenue (most visible in PSE data and also reflected in national residential natural gas prices) was likely due to a combination of factors, including the West Coast energy crisis leading to general market volatility, as well as a national spike in wholesale natural gas prices due to low storage levels, as well as increased demand from cold weather and strong economic growth.
Key Takeaways
- As of 2024, PSE and NW Natural are the two largest natural gas utilities in Oregon and Washington (by number of customers and sales volume). PSE leads in residential sales volume and customers. PSE also has the largest commercial sales volume, but NW Natural serves more commercial customers. In the industrial sector, NW Natural has the largest sales volume while PSE serves more customers at lower average volumes.
- All natural gas utilities shown serve more residential customers than either industrial or commercial customers, and the number of residential natural gas customers has increased for all since 1997.
- PSE had the highest sales revenue from 1997-2023, but NW Natural had slightly higher sales revenue in 2024.
- Natural gas sales volume trended downward in 2023 and 2024 and may continue to decline as Oregon and Washington implement clean buildings legislation and electrification policies. Subsequent years of data will be added to this visualization as they become available and can help confirm whether this trend persists.
- There are a variety of factors that influence natural gas utility sales and revenue, and natural gas is subject to price volatility based on global markets.
Hover your mouse over the visualization to see exact data and click on each element for more options. Filter by year, state, natural gas utility, and customer type by using the dropdown menu or checkbox menus on the right-hand side.

Click on the "reset" button (third from the left in the bottom right-hand toolbar) to return to the original view. To learn more about interacting with the visualizations, visit Tableau Tips.